
How to Look Up Lehigh County Jail Population Data
Lehigh County does not run a live public dashboard for its jail population. The county's official corrections pages post bed capacity and facility details, but they do not publish a daily headcount, a demographic chart, or a pretrial split. The clearest official figures come from the Lehigh County Jail page and the Community Corrections Center page. Those two sources give rated capacity for each site. Capacity is a fixed number set by the facility. It is not the same as how many people sit in custody on a given day.
For population trends and rate-based numbers, the data lives outside the county. The Vera Institute Pennsylvania page holds a county comparison table with jail and prison metrics, and the Bureau of Justice Statistics holds national jail data and methodology. Vera's Pennsylvania page was last updated February 9, 2026. When reading these sources, keep one rule in mind. County capacity numbers are official Lehigh County figures. The rate-per-100,000 numbers and trend lines from Vera and BJS are research estimates built from broader datasets, not a county-published live count.
Lehigh County Jail Capacity Overview
The county runs two corrections sites, and they serve different roles. The Lehigh County Jail is the main secure facility. It opened in 1992 and spans 250,000 square feet. It is a maximum-security, direct-supervision high-rise jail with a rated capacity of 1,352. It holds pretrial detainees and people serving local sentences. The second site is the Community Corrections Center. It is a 400-bed facility, renovated in 2011, built as an alternative to secure confinement for sentenced individuals.
The official corrections pages describe the jail's high-rise design and its supervision model. The lead-in image below comes straight from the Lehigh County Jail page.
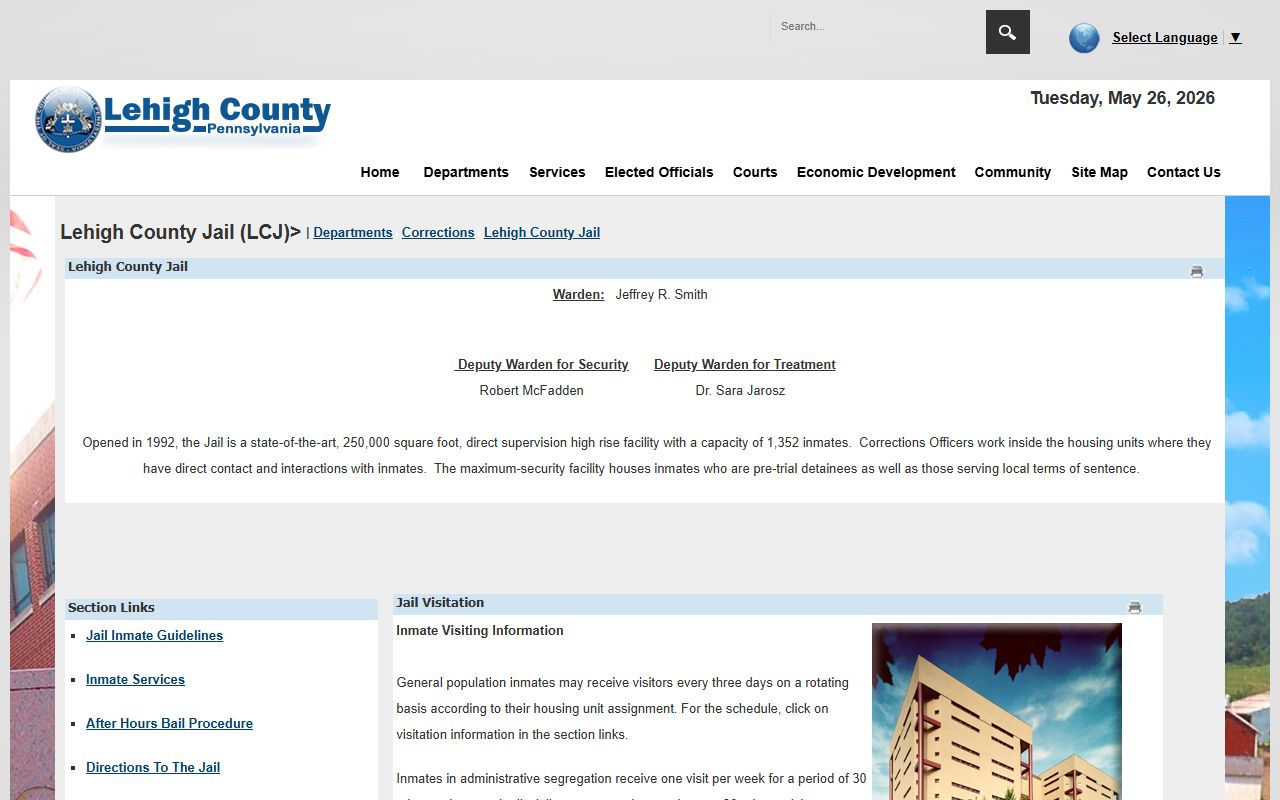
That jail page lists the warden, the facility size, and the bed capacity used in the table here. Add the two sites together and the county's total stated corrections capacity is 1,752 beds. Treat that total with care. The 1,352 figure is secure jail beds. The 400 figure is community corrections beds. They are not the same custody level, so the combined number should not read as 1,752 maximum-security beds.
| Facility | Type | Rated Capacity |
|---|---|---|
| Lehigh County Jail | Maximum-security direct-supervision jail | 1,352 |
| Community Corrections Center | Community corrections / work release | 400 |
| Total county corrections capacity | Jail plus CCC | 1,752 |
Note: rated capacity is a fixed ceiling, not the number of people held on any given day.
Average Daily Population
Average daily population, or ADP, is the mean count of people held across a year. It smooths out the daily swings that come as people are booked in and released. For Lehigh County, an official current ADP was not located in the county's published sources during research. The corrections pages post capacity, not a running count. So the honest answer here is plain: the county-published ADP is not available from the official sources reviewed.
This matters for how the capacity numbers get read. A 1,352-bed jail does not mean 1,352 people are held. Daily counts in county jails usually sit below rated capacity, and they move with arrest rates, bail decisions, and court backlogs. Without a county count, the best stand-in is the rate-based context from Vera and BJS shown further down. Those figures are estimates for the county and the state, not a live Lehigh County headcount.
Note: where this page lacks a county number, that gap is stated plainly rather than filled with an estimate dressed up as official data.
Demographic Breakdown
A demographic breakdown shows how a jail population splits by gender, race, and age. Many large county systems publish these charts. Lehigh County does not post a public demographic breakdown of its jail population in the official corrections sources reviewed. So a county-specific gender or race split cannot be shown here without inventing it, and that is not done on this page.
The table below lists the standard fields a full demographic report would cover, and marks the current data status for Lehigh County. It is meant to show what is and is not available, not to imply numbers the county has not released.
| Demographic Field | Lehigh County Data Status |
|---|---|
| Gender split | Not published in official sources reviewed |
| Race and ethnicity | Not published in official sources reviewed |
| Age distribution | Not published in official sources reviewed |
| Jail incarceration rate | Estimated by Vera Institute, not county-published |
For statewide demographic patterns, the Bureau of Justice Statistics is the better source. BJS reports national and state jail data by race, sex, and conviction status, and explains its methods.
Pretrial vs. Sentenced Population
County jail populations split into two broad groups. Pretrial detainees are people held before their case is decided, often because bail was set and not posted. Sentenced individuals are people serving a term after conviction. The two groups are housed and managed in different ways, and the line between them shapes how a county uses its beds.
In Lehigh County the design of the two sites maps onto this split. The Lehigh County Jail holds pretrial detainees and people serving local sentences. The Community Corrections Center holds sentenced individuals only, and gives them a structured alternative to secure confinement. The county does not publish an exact pretrial-to-sentenced percentage for the jail, so the table compares the two statuses by role rather than by a fabricated share.
| Status | Who It Covers | Where Held in Lehigh County |
|---|---|---|
| Pretrial | Held before trial or plea, often on unposted bail | Lehigh County Jail |
| Sentenced (secure) | Serving a local term in custody | Lehigh County Jail |
| Sentenced (community) | Work release and structured community programming | Community Corrections Center |
The image below comes from the Community Corrections Center page, which explains the work-release model for sentenced individuals.
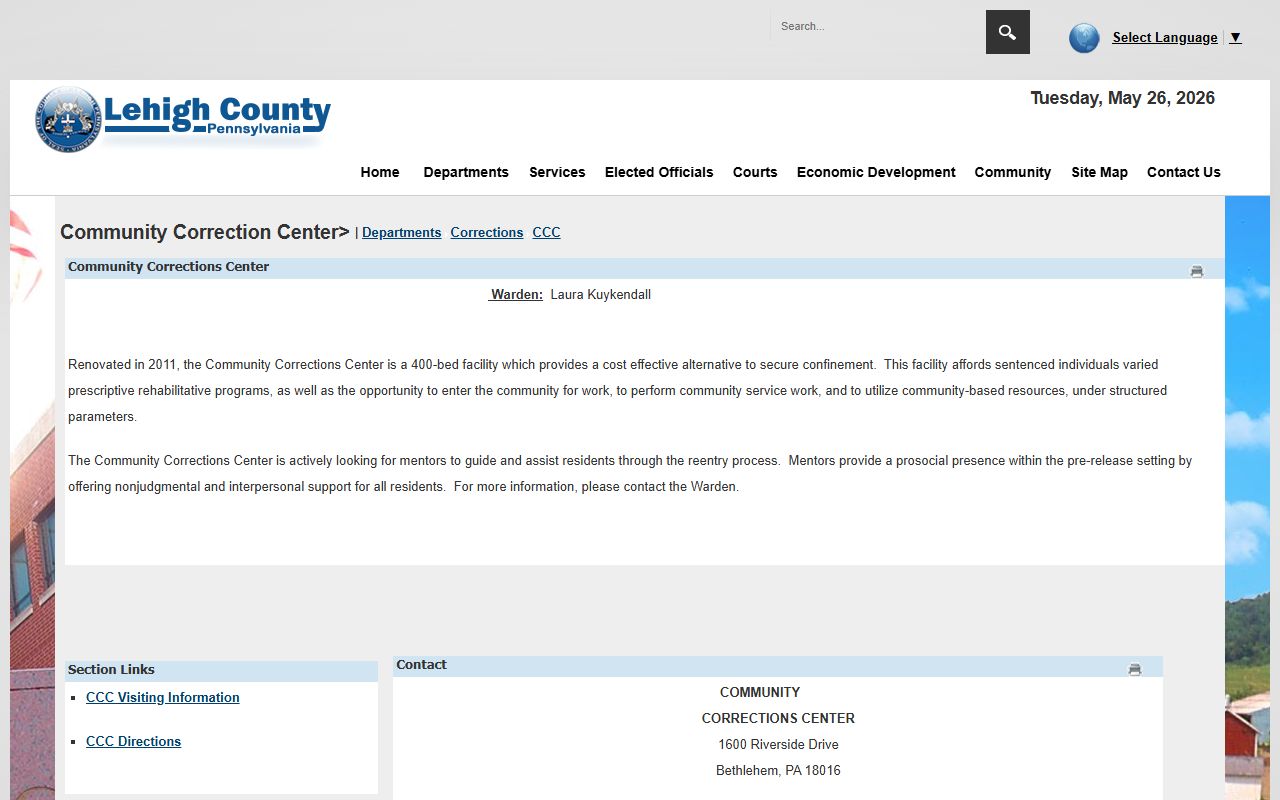
That page makes clear the CCC is not maximum-security custody. Its 400 beds support sentenced people who may work, perform community service, and use community resources under set rules.
Misdemeanor vs. Felony Population
A charge-level split shows how many held people face misdemeanor charges versus felony charges. It helps explain why some people sit in custody for days and others for months. Lehigh County does not publish a misdemeanor-versus-felony breakdown of its jail population in the official sources reviewed, so no county percentage is shown here.
What the official record does tell us is the kind of cases the jail handles. The Lehigh County Jail holds pretrial detainees across charge levels and people serving local sentences, which in Pennsylvania generally means terms of under two years. People sentenced to longer state terms move to the state prison system, not the county jail. That structure shapes the charge mix even without a published chart. For case-level charge detail on a named person, the live roster and court dockets are the better route. See Lehigh County arrest records for charge and booking information.
Mental Health and Medical Population
Jails screen people at intake for medical and mental health needs. That screening sets housing and care plans. Lehigh County's intake process includes medical and mental health screening as part of booking, and the jail runs treatment programming for people in custody. The county does not publish a count or percentage of the population receiving mental health or medical care, so no share is stated here.
The jail does maintain dedicated treatment staff. Official records name a Deputy Warden for Treatment among the jail's leadership, which signals a formal treatment function inside the facility. For broader patterns, BJS studies mental health and medical care across U.S. jails and reports national figures and methods. Those national numbers give context but should not be read as a Lehigh County count.
National and State Context
To judge whether a county jail runs large or small, analysts use a rate per 100,000 residents. The rate adjusts for population size so a small county and a big one can be compared. Two sources carry these numbers. The Vera Institute Pennsylvania page holds a county comparison table with jail incarceration rates, and the Bureau of Justice Statistics reports the national jail rate and its methods.
The image below is from the Vera Institute Pennsylvania page, the source for the state and county comparison data.
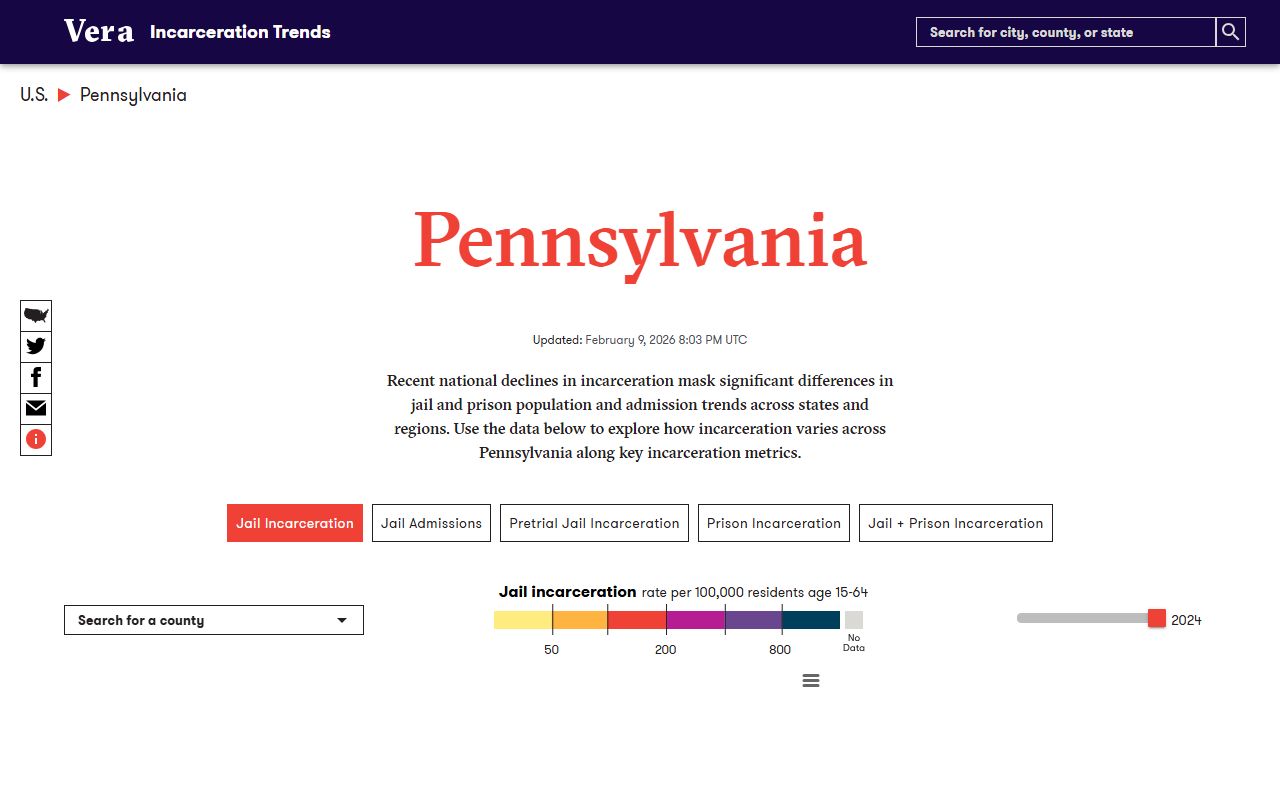
Vera lets you open Lehigh County inside its interface to see the local jail rate per 100,000 residents age 15 to 64, plus a ten-year change figure. The comparison table below shows how the rate concept stacks across levels. The Lehigh County rate is the one gap to flag: a county-specific rate was not pulled into this research pass, so use the Vera county tool for the live county figure, and read the state and national entries as research estimates, not county-published counts.
| Level | Jail Rate Source | Status |
|---|---|---|
| Lehigh County | Vera Institute county comparison table | Look up live in the Vera tool; not pulled here |
| Pennsylvania | Vera Institute state page | Research estimate, not county-published |
| National | Bureau of Justice Statistics | National estimate, not county-published |
Note: the rate per 100,000 is an estimate built from broad datasets, so it can differ from a county's own daily count.
Population Trends Over Time
A trend line shows whether a jail population is rising, holding, or falling over several years. Lehigh County does not publish a multi-year trend of its own jail population in the official sources reviewed, so a county-published trend cannot be charted here. The data gap is real, and it is stated rather than papered over.
The Vera Institute does track change over time. Its Pennsylvania page includes a ten-year change metric for counties, which lets you see the direction of the county's jail rate even without a county dashboard. National jail trends, including how counts shifted around 2020, are covered by the Bureau of Justice Statistics. For a future refresh of county-specific numbers, useful sources would include Lehigh County budget documents, corrections annual reports, and any published prison board minutes. None of those carried a current population figure in this pass.
Searching for Lehigh County Inmate Records by Name
The figures here cover aggregate jail population data, not a single person. To look up one named individual in custody, use Lehigh County inmate records for the jail roster route, or released inmates if the person may already be out. Active wants are covered under Lehigh County warrant records.
Where the Data Comes From
Every number on this page traces to one of a few sources, and each plays a different role. The bed-capacity figures are official Lehigh County corrections data, drawn from the Lehigh County Jail page and the Community Corrections Center page. Those are the county's own published facts about its facilities.
The rate and trend context comes from two research datasets. The Vera Institute supplies county and state comparison tables, last updated February 9, 2026 for Pennsylvania. The Bureau of Justice Statistics supplies national jail data and methodology. The image below is from the BJS site, the federal source for national jail statistics.
BJS data is national and state level, so it frames the bigger picture rather than the county count. Third-party "inmate roster" sites were left out on purpose. Their Lehigh numbers conflicted with the official capacity figures, so they are not used as a source here.